These are the results from the PyMOL refresher.

Fig 1: This is a picture of the NAP molecule (in red) in the active site of the 2H2Q active site. Notice the yellow dashed lines which represent the polar contacts between the substrate and the protein’s active site. There are several polar contacts which can suggest that the active site is highly polar and this is a hydrophilic substrate.

Fig 2: This picture shows the DU cofactor (in red) that is found in the 2H2Q protein. It is possible to say that this cofactor is slightly hydrophobic due to the small amount of polar contacts between the cofactor and the protein’s active site.
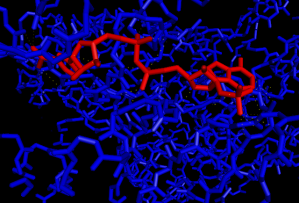
Fig 3: This picture shows the NAP substrate (in red) in the 3CL9 protein’s active site. The NAP substrate is a hydrophilic molecule and this can be seen based on the high number of polar contacts between it and the protein’s active site.

Fig 4: This picture shows the MTX substrate (in red) in the 3CL9 protein’s other active site. This molecule has hydrophilic tendencies which can be seen in the number of polar contacts it has with the active site of the protein.
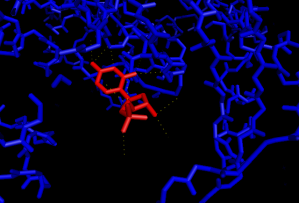
Fig 5: This picture shows the polar contacts between the active site of 3CL9 and the UMP cofactor (in red). This cofactor, too, is hydrophilic because of the number of polar contacts between this molecule and the active site.

Fig 6: This picture shows the EDO cofactors (in red) in the 3CL9 protein. These molecules are highly hydrophobic because they are found inside of the protein. Also, there are not a lot of polar contacts between the cofactors and the protein.

Fig 7: This picture shows the chlorine atoms (in red) that are found within the 3CL9 protein complex. There are no polar contacts between the chlorine atoms and the 3CL9 protein.
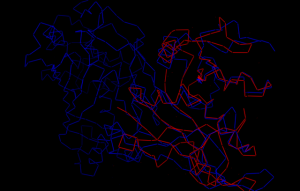
Fig 8: This picture shows the superimposed structures of the 1U72 and 3CL9 protein proteins. The 3CL9 protein is in blue and the 1U72 protein is in red. The RMS value for this superimposition is 3.571.
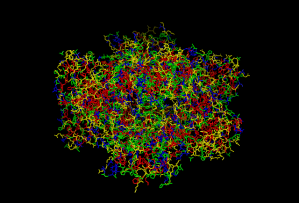
Fig 9: This picture is of the protein 3HBB. The hydrophobic amino acids are in red, the polar amino acids are in blue, and the ionic amino acids are in yellow.

Fig 10: This picture shows the NAP substrates (in red) in the active sites of the 3HBB protein. These molecules are hydrophilic which can be seen through their large amounts of polar contacts between the NAP molecule and the protein.

Fig 11: This picture shows all of the substrates and cofactors found within the 3HBB protein complex. The following cofactors and substrates are: TMQ (in green) cofactor, the SO4 (in yellow) cofactor, the NAP substrates (in red), and the EDO (in pink) cofactor. None of the cofactors have shown any visible polar contacts.
Filed under: Uncategorized | Leave a comment »


You must be logged in to post a comment.