Here are my results from the DMSO Tolerance Assay.
The next step is inhibition assays!!!
Filed under: Uncategorized | Leave a comment »
Here are my results from the DMSO Tolerance Assay.
The next step is inhibition assays!!!
Filed under: Uncategorized | Leave a comment »
Here are the results from the substrate assay. There was a great disparity in my trial 1 and trial 2 values so no average was taken. The final substrate (pNPP) concentration that will be used for the inhibition assays will be 5mM.
Filed under: Uncategorized | Leave a comment »
After failing once, I believe (hopefully) that my first enzyme assay worked! Initially I did not dilute the enzyme sample so I had extremely high absorbance values. Here are the results from the correct experiment…
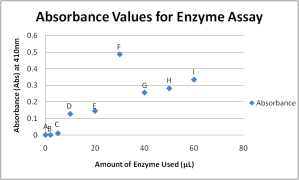
Graphical representation of absorbance values taken from the enzyme assay on PTP1B. Overall best sample is Sample G
My plots kind of follow the trend that we discussed during lecture with the exception of the one extreme, Sample F. The sample that will be used for the Vary Substrate Assay will be Sample G.
Filed under: Uncategorized | 4 Comments »
Thus far, I have been having trouble running my Aggregate Run. I have been cleaning clusters and killing jobs like crazy. So to fix this, I think I might have to re-do my .sdf file and use the lenix command. Hopefully, this will work and I wont have to kill any more jobs. Also I have complete protein expression so the next step is for me to create a gel to see the bands that correspond to protein expression and go on to purification.
Filed under: Uncategorized | Leave a comment »
So, I finally finished cloning and performed my restriction enzyme digest on my cloning samples. My gel results did not come out the way that they were supposed to. According to the custom gel, each of my cloning samples should have had 3 bands, representing the cuts made by XmnI and BsrGI. The following well contain the following:
Lane 1: 100 Kb DNA Ladder
Lane 2: Tube A, Colony 1 (8.3 ng/uL)
Lane 3: Tube B, Colony 1 (12.2 ng/uL)
Lane 4: Tube B, Colony 2 (14.6 ng/uL)
Lane 5: Tube B, Colony 3 (19.8 ng/uL)
Lane 6: Tube B, Colony 4 (27.3 ng/uL)
Lane 7: Tube B, Colony 5 (10.2 ng/uL)
Lane 8: pNIC-Bsa4 cut (31.4 ng/uL)
Lane 9: pNIC-Bsa4 uncut (31.4 ng/uL)
Despite not having all of the bands, I am still going to send my samples to the DNA Sequencing Lab. The next step in protein expression and purification, which is what I am currently working on now. Virtual Screening is now complete and my Aggregate Run finished today. I was delayed in my final run because I was having issues with running the Kinase Library. Unfortunately, I could not incorporate the Top Ligands from the Kinase Library because I was experiencing too many errors with it.
Filed under: Uncategorized | 1 Comment »
I started on cloning on 10-20-10 and after 1 failed attempts, I am finally seeing positive results. The first time that I tried cloning, I had a small bacterial yield on my colonies. The component cells had 25uL rather than 50uL. This means that the initial tube could have possibly been contaminated, which could have altered my yield. I took another tube of competent cells and, instead placing used component cells into the fridge, I split the remaining 25uL into the tubes. I did the Master Plate and made my conical tubes. Unfortunately, I combined both samples of cells, which contained different concentrations, into the same conical tube. This would have provided me with bacterial cells without knowing the exact concentration of pNIC-Bsa4: Target used. These are the resulting plates from the first transformation.
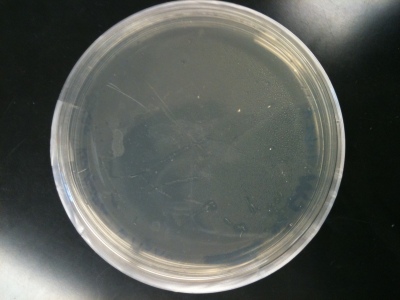
Trial 1 Tube B: Notice this plate has more bacterial cells produced than the plate containing Plate A, but the overall size of the colonies is small.
I re-started on the cloning this past weekend. I encountered a few possible errors during the duration of this experiment. First, I used the target and pNIC-Bsa4 solutions that were created a week in advanced. It is always better to have freshly made solutions. Also, on the transformation step of the protocol, I placed the tubes into the shaker for 16hrs as opposed to the 1hr requirement on the protocol. Although these errors could have produced negative results, I ended up getting a better yield than before. The following pictures shows the bacterial colonies grown on the plates after transformation.
Now, I am about to start on isolating the plasmids, that should hopefully contain my target insert, from the component cells.
Filed under: Uncategorized | Leave a comment »
After having poor bands on the 3rd run of PCR and nothing on the gel electrophoresis of my DNA Amplification, I redid a PCR of my samples. This following picture shows the results….
Lane 2: 100 bp DNA Ladder
Lane 3: Sample A
Lane 4: Sample B
Lane 5: Sample C
Lane 6: Sample D
Lane 7: Sample E
Lane 8: Sample F (control No DNA)
So this, by far, is m6y best PCR results. I combined Samples B,C,D, and E and did a PCR Cleanup. I nanodropped the eluate and it showed that my DNA had a concentration of 18 ng/uL. Unfortunately, this concentration is a little too low so I had to re-do PCR all over again.
I am currently working on pNIC-Bsa4 cloning with the low concentration sample and making a new, and hopefully higher concentration, sample.
Filed under: Uncategorized | Leave a comment »
The molecule that I chose was Bacillus anthracis, better known as Antrhrax. This molecule is a very dangerous molecule because it can cause damage, especially when airborne. It has been used a type of biological warfare. Here is a picture of the main complex.
This is the crystal structure of a putative 4-hydroxy-2-oxoglutarate aldolase from the Bacillus anthracis. This molecule contains Cl and Na molecules.
This is the award winning picture!!!! Notice the shocked and surprised face that I found within the molecule. Looks kind of similar to how I would look if I found anthrax!!!
Filed under: PyMol Image Contest | 2 Comments »
Thus far, I have worked on my DNA amplification and the first part of the PNIC-Bsa4 cloning. After completing the DNA amplification, I ran my samples in a gel only to be disappointed, yet again, with the outcome. My bands were very faint except for the one on the in Lane 6. Lane 6 was my control and was NOT supposed to have DNA. After reflecting on my actions during this lab, I realized that I made a change to the melting temperature on my PCR protocol. After thinking some more, I might have been using the wrong melting point temperature (which was derived from the PCR Primer Design Lab and not from the primers designed by Dr. B. for the PCR lab). So I have decided to completely start over on the PCR with the correct melting temperature and hopefully I will see a beautiful, bright band on my gels. After messing up on PCR so many times, I am beginning to really like the process of it. TOO BAD IT DOESN’T LIKE ME LOL!!!!
Lane 1: SKIP
Lane 2: 100bp DNA Ladder
Lane 3: Sample D-1
Lane 4: Sample D-2
Lane 5: Sample D-3
Lane 6: Sample D-4
Lane 7: Sample D-5
Lane 8: Sample D-6 (control No DNA)
As far as the virtual screening goes, I have finished screening the HF9 Library. I screened the library twice and am now screening the CB_306_3D Library. Because of the small size of this library, I am only going to do one run. I still have a lot of libraries to screen, but I will next screen the larger NIH Clinical Collection and the Chembridge Diversity Libraries.
Filed under: Uncategorized | Leave a comment »
I guess three times is a charm! My PCR finally worked on the third time and produced differing bands in the gel. This time, I made all of the correct dilutions and added the correct amounts of solutions. This is the gel that was produced from the third PCR run of my target clone HsCD00002513:
Lane 1: Skip
Lane 2: 100bp DNA Ladder
Lane 3: Solution A
Lane 4: Solution B
Lane 5: Solution C
Lane 6: Solution D
Lane 7: Solution E
Lane 8: Solution F
The two bands that are expressed in this gel is Solution D and E. Although they are on the same band, I will most likely re-PCR both solutions but use Solution D for the remainder of my target study because it has a larger band. I will use Solution E as a back-up just in case anything goes wrong. The next step for me is to re-PCR the solution that showed up the best in the gel (Solution D) and do a PCR clean-up to retain only the DNA. One thing that PCR has taught me is patience and precision.
Filed under: Uncategorized | 5 Comments »
After 2 days and 2 PCR repeats, I have to do PCR over AGAIN. The first attempt at PCR was rushed to say the least. I made several errors including making incorrect dilutions, not making dilutions at all, and other careless mistakes that can occur when doing tedious work like PCR. Despite making numerous errors, I ran the samples anyways and came with the following results in the gel:
Notice the bands are all on the same level and there is no distinction in the bands. There should be some distinction between the bands because there are different amounts of ingredients in the various samples. So once the first PCR sample was ran through in a gel, I redid the PCR again by paying careful attention to detail. Unfortunately, I made an incorrect dilution for the KOD DNA polymerase and this is the gel electrophoresis of these samples:
So, tomorrow I shall re-embark on my journey to PCR-land. Hopefully by the end of it, I will have a correct gel sample.
Filed under: Uncategorized | 4 Comments »
By far, the Midi Prep lab has been one of my most favorite and yet my longest lab to this day. I enjoyed seeing the visual changes and understanding the chemical reactions that were causing these changes. Some errors to note are:
– did not add isopropanol on Step 13, so I had to re-centrifuge the tube with isopropanol
-while in the centrifuge for the 2nd time on step 13, it was stopped constantly for 15 minutes due to trying to accommodate another researchers samples
-did not save any of the analytical samples for future testing
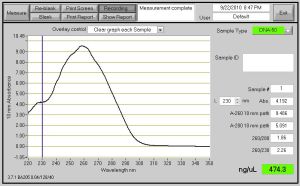
This is a graphical representation of the concentration of the DNA. Notice on the side in green, the concentration of the DNA is 474.3 ng/uL.
After the completion of the Midi Prep, I was able to use the Nanodrop to determine the concentration of my isolated DNA sample. In the end, I had about 474.3 ng/uL of pure DNA in my sample.
Filed under: Uncategorized | 3 Comments »
These are the results from the PyMOL refresher.

Fig 1: This is a picture of the NAP molecule (in red) in the active site of the 2H2Q active site. Notice the yellow dashed lines which represent the polar contacts between the substrate and the protein’s active site. There are several polar contacts which can suggest that the active site is highly polar and this is a hydrophilic substrate.

Fig 2: This picture shows the DU cofactor (in red) that is found in the 2H2Q protein. It is possible to say that this cofactor is slightly hydrophobic due to the small amount of polar contacts between the cofactor and the protein’s active site.
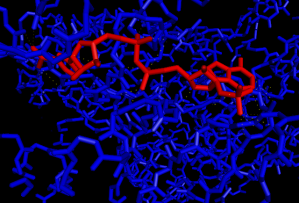
Fig 3: This picture shows the NAP substrate (in red) in the 3CL9 protein’s active site. The NAP substrate is a hydrophilic molecule and this can be seen based on the high number of polar contacts between it and the protein’s active site.

Fig 4: This picture shows the MTX substrate (in red) in the 3CL9 protein’s other active site. This molecule has hydrophilic tendencies which can be seen in the number of polar contacts it has with the active site of the protein.
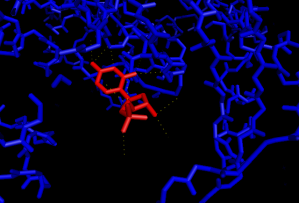
Fig 5: This picture shows the polar contacts between the active site of 3CL9 and the UMP cofactor (in red). This cofactor, too, is hydrophilic because of the number of polar contacts between this molecule and the active site.

Fig 6: This picture shows the EDO cofactors (in red) in the 3CL9 protein. These molecules are highly hydrophobic because they are found inside of the protein. Also, there are not a lot of polar contacts between the cofactors and the protein.

Fig 7: This picture shows the chlorine atoms (in red) that are found within the 3CL9 protein complex. There are no polar contacts between the chlorine atoms and the 3CL9 protein.
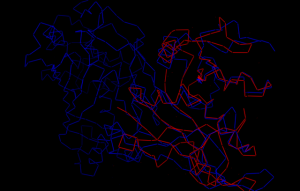
Fig 8: This picture shows the superimposed structures of the 1U72 and 3CL9 protein proteins. The 3CL9 protein is in blue and the 1U72 protein is in red. The RMS value for this superimposition is 3.571.
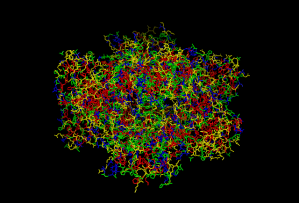
Fig 9: This picture is of the protein 3HBB. The hydrophobic amino acids are in red, the polar amino acids are in blue, and the ionic amino acids are in yellow.

Fig 10: This picture shows the NAP substrates (in red) in the active sites of the 3HBB protein. These molecules are hydrophilic which can be seen through their large amounts of polar contacts between the NAP molecule and the protein.

Fig 11: This picture shows all of the substrates and cofactors found within the 3HBB protein complex. The following cofactors and substrates are: TMQ (in green) cofactor, the SO4 (in yellow) cofactor, the NAP substrates (in red), and the EDO (in pink) cofactor. None of the cofactors have shown any visible polar contacts.
Filed under: Uncategorized | Leave a comment »
So everything that could go wrong, went wrong this past week in lab. I had struggle the Virtual Screening Refresher and could not get my run to actually RUN! Now, it is running so that is a relief. I got my target clone which I am really excited about. The initial sample of the HsCD00002513 was deemed “insufficient” based on the label on the tube. So I had to wait for a new sample to be created and I could determine the sequence of the plasmid by taking it to the CORE. Also, I discovered something rather weird about my vector, pDNR-Dual. This vector has two forward primers. Normally, most have a forward and a reverse primer. So it will be interesting to see how this plays out in the future.
Filed under: Uncategorized | 2 Comments »
The main purpose of this lab was to amplify the purple protein coding sequence in the pGBR22 plasmid using forward and reverse primers. For the most part, the lab when according to the protocol despite two errors. One, the samples were not on ice the whole time. They were out of the ice for approximately 10 minutes which could have possibly altered my results. Also, when adding the Thermopol buffer to Sample C, the intake was very frothy and bubbly so there could have possibly been an inadequate amount of the buffer solution added to the sample. Lastly, when adding the samples into the wells of the gel, the lane that contained Sample B, did not contain as much as the other wells due to a technique error on my behalf. Although these errors were small, they could have greatly altered the outcome of the results. This was the first time that I have ever did a PCR lab, so it was very interesting. From reading background information, PCR is a scientific technique which amplifies small samples of DNA by generating a lot more copies of specific DNA sequence. The samples were definitely amplified as seen on the electrophoresis gel. This lanes consisted of the following:
Lane 1: skip
Lane 2: 100bp DNA Marker
Lane 3: Sample A
Lane 4: Sample B
Lane 5: Sample C
Lane 6: Sample D
Each sample was comprised of a specific amount of a 10X Thermopol Buffer solution, 10mM stock concentration of dNTP, a forward primer, a reverse primer, a DNA template (excluding Sample D), a DNA polymerase Tag, and Deionized water. The final concentration of these samples were approximately 25 uL. You can see the amplification of the DNA, especially in Lane 5 for Sample C. The bands on the DNA Marker corresponds to the number of base pairs of the samples. So the samples generally had anywhere from 400 to 500 base pairs.
Filed under: Uncategorized | Leave a comment »
You must be logged in to post a comment.