Leighanna – your substrate is in. Stored in VDS cubby at room temp.
Filed under: Enzyme Assays, Mentors, Supplies | Leave a comment »
Leighanna – your substrate is in. Stored in VDS cubby at room temp.
Filed under: Enzyme Assays, Mentors, Supplies | Leave a comment »
krj439Enzyme Activity Assay Check 1_24_11Looks like it might have died. I used the new spectrophotometer and the cuvette wasn’t very full so I might retry with the other cuvette.
Filed under: Enzyme Assays, Uncategorized | Leave a comment »
Make plasmid stocks:
Grow up 2×80 ml of pGBR22 in DHFalphas overnight for MaxiPrep
Grow up 2×80 ml of PTP1b in pNIC-Bsa4 in DHFalphas overnight for MaxiPrep
Prepare PTP1b enzyme for new enzyme assay Lab: (IN TEAMS OF 2)
Radhika: re-transform PTP1b into Bl21(DE3) and DH5alphas
Prepare 4 liters of LB – autoclave
Autoclave big flasks – maybe use Biotech lab’s
Expression (overnight and then next day with IPTG)
Purification
Characterization
Concentration, buffer exchange
FPLC purification (Dr. B and Leighanna)
Once we have enzyme: PTP1b enzyme assay test
Also, GOLD Virtual Screen 3 Lab for PTP1b (using GOLD GUI to set up protein)
Filed under: Enzyme Assays, Mentors, protein expression, Virtual Screening | Leave a comment »
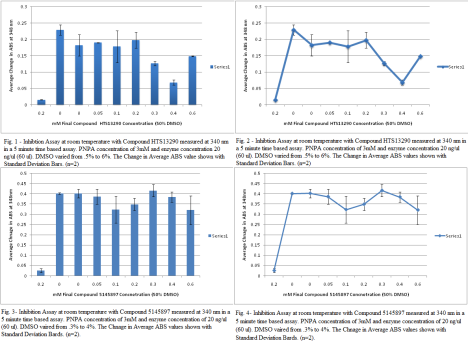
I used HTS13290 for my inhibition assay #2 at 5mM concentration. It worked. I was so happy. The importance of this assay is that the when inhibitor is in high concentration in the solution, there’s a saturation point. Another importance is that in this assay, the highest DMSO amount was 6% and from my DMSO assay the optimal concentration was under 4% DMSO. So as more Compound with DMSO was added to solution, the increasing DMSO could have altered the fuction of the protein and gave inconsistent results of inhibition at high compound concentration. The only thing I did differently was choose a new a inhibitor. Everything stayed the same for the previous inhibition assay.Also, my graphs from my first inhibition assay are posted on this one as well. For the HTS13290SC, 100 ul of nanopure, 80 ul of 100% DMSO and 20 ul of Compound HTS13290SC in stock. For Compound 5145897, 126.67 of Nanopure was used with 88.67 of 100% DMSO and 38 ul. of the stock compound. The working concentration for Compound 897 was 7.5 mM and for HTS13290 it was 5 mM.
 *Note- Inhibition is spelled wrong.
Filed under: Enzyme Assays | Tagged: assaySO | 1 Comment »
These are my results from the DMSO tolerance assay. I don’t know why the standard deviation on some of them is so high =/ Anyway, which percentage should I use in my inhibition assays? I feel like the lowest one would be the best. Although 3.2% seems to have the highest absorbance, I think this is probably a personal error and I wouldn’t want to take my chances using that much DMSO since the general trend is decreasing absorbance.
Filed under: Enzyme Assays | 2 Comments »
Well, for this last week, I will be working on my last trail for my inhibitor and then I will test another inhibitor. The first trail I did on my inhibitor did not seem to go well. When I added 6x the amount of inhibitor, it changed the ABS value at about the same rate. That made no sense, but I should have waited 5 minutes during incubation then measures the ABS, once that finished waited 5 minutes again and measured again. Instead I tired to make them go back to back and I could not remember if I had added inhibitor or PNPA. Next, time I will go one by one. I had to add 126.67 ul of Nanopure, 88.67 ul of 100% DMSO and 38 ul of my 5145897 inhibitor. My DMSO was 3 mM and protein was sill 60 ul of the 20 ng/ul enzyme concentration. The DMSO worked best under 4 % and all the DMSO was kept below 4%. I should have a graph up tomorrow when I perform my last inhibitor assay trail. Watch out for the inhibition assay. If you have a time based assy, do it one at a time. Also, make sure all the solutions are kept orderly so that you can keep track of what goes into the solution. I hope everyone had a good Thanksgiving. Now its time to finish up that report and finish up the last steps of our research.
Filed under: Enzyme Assays, Uncategorized | Tagged: assaySO | 2 Comments »
This past week, I dried my SDS page gel. Despite my laying the gel on TOP of the sealing gasket instead of underneath and having to rehydrate and dry my gel again, it came out in one piece.
Lane 1: 7ul Prestained protein marker #SM0671
Lane 2: 20ul Sample 1 (cell lysate after induction)
Lane 3: 20ul Sample 2 (soluble fraction)
Lane 4: 20ul Sample 3 (flow through)
Lane 5: 20ul Sample 4 (wash)
Lane 6: 20ul Sample 5 (elution 1)
Lane 7: 20ul Sample 6 (elution 2)
In lane 6, you can see one clear band which means the Ni-NTA resin successfully stripped away any junk protein, leaving only the purified protein.
In lane 7, you don’t see anything because the second elution step washes away even more protein.
Also this week, I did my first enzyme assay:
Filed under: Enzyme Assays, GelImages | 1 Comment »
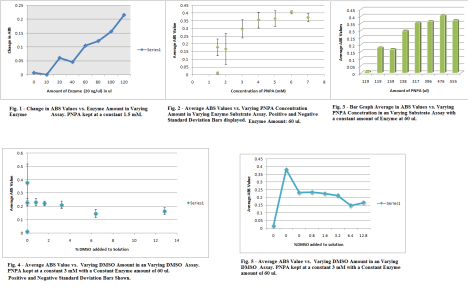
So. Friday. I lived in lab. I performed two varying substrate assays and two varying DMSO substrate assay. It was pretty straight forward. After I did varying substrate assay test, I took the values from the two different varying substrate assays and found their change. After the change was found from the two trails of assays I found the average of the change and found the Standard Deviation for the values. The enzyme amount used in the varying substrate was 60 ul of the 20 ng/ul Enzyme. When making solutions of my CA7 Protein in Tris Buffer, I would allow my protein to un-thaw, but as soon as I put it in the centrifuge tube, it would go directly back into the -4 degree refrigerator. The different concentrations of Substrate were 1.5,1.5,2,3,4,5,6,7 mM. The graph began to stabilize with the Standard Deviation off at about 3 mM and this was the concentration used in the DMSO assay. When looking at the graphs, you want to look at the place where thing begin to stabilize or decrease when adding the variant amount of substance whether its enzyme, substrate or DMSO. The DMSO assay only had varying amounts of DMSO (enzyme, PNPA is constant) as well and I was looking for that same stabilizing image to give me a proper DMSO value to use in inhibition assay. After adding 3.2% DMSO to the solution it begins to affect the function of the protein and substrate and the change in ABS values become small, and this is not what is desired. A functional protein is a must. Note: still done at the 15 sec 5 minute readings at the wavelength 348 nm. (Click the IMAGE to get a full view) Note: the Average ABS value is the Average for the Change of ABS Values Also, when doing assays, I think a little trick is to add the Tris first, water, protein, and then the PNPA (DMSO last if doing the DMSO assays) When adding the PNPA before the protein, it could not allow the substrate to function in the active site as well. That may not be 100% true, but at least add the solution together a little before OD to let everything work together. TIP: When doing Standard Deviation or my acronym, (Finding the STD (Standard Deviation) LOL! Not Funny :] ) Anyways, On Excel 2007, go to the Layout Tab, go to error bars, more error bar options, then to custom on the bottom of page, and choose the calculated standard deviation values as the positive and negative values. Delete the horizontal error bars, by clicking on the horizontal bars on the graph and pressing delete.
Filed under: Enzyme Assays, Uncategorized | Tagged: assaySO, Standard Deviation | 1 Comment »
VDSers – the inhibition assay protocols are posted. Yeah – the last experiments!
You should complete the other Enzyme Assays (vary enzyme, vary substrate, vary DMSO) before proceeding to the inhibitors.If you are still working on protein characterization – I would strongly urge you to being your assays and come back to the characterization steps.
Also, you show your enzyme assay results to Dr. B (electronically – blog preferably) before proceeding to inhibition.
The inhibitors are expensive and are common stock (i.e. we will all share them). So, it is important that these be diluted properly. Also the Inhibition protocol is a little different in that it requires a pre-incubation.
Filed under: Enzyme Assays, Housekeeping, protein expression, Protocols | Tagged: inhibition | Leave a comment »
So, The week began with concentrating my protein to get out any other extra cellular material that would have otherwise been in solution during assays that could disrupt the function of the CA7 protein. The 15 ml cylinder filter was 20 kD, so my protein should have stayed in solution with the elution buffer during centrifuging to get the material out. I had to centrifuge the solution twice for 20 minutes to get the volume down to .5, but on the second centrifuge there was less than .5 in solution. To make up for this we had to add 500 ul of storage buffer to the tube and Nanodrop the solution to see what the protein concentration was. Before adding the glycerol, the protein concentration was 34.2 uM. After the protein was concentrated, I could now to assays. While preparing for the assay, I had to make PNPA solution, but when weighing out the solid I used the wrong balance. I added a minute amount of the PNPA , but the solution was yellow already which was not a good sign. When I made the PNPA for the second time, I used the ug balance to ensure I had the right amount of PNPA solid. Once the PNPA solid was made, I had to get the concentration of my protein down to 20 ng/ul and to do this I had to add 4 ul of my 31.184 uM Protein with glycerol, to 181.195 ul of Tris HCL Buffer at pH of 7.6. I needed a lot of protein about 400 ul to run the whole assay, I had to add about 12 ul of protein and 545.85 ul of Tris Buffer. Once all the prep was was complete, I proceeded to run my assay that had the different amount of protein in Sample A-H. As the assays were running and more protein was added to the solution the higher the absorption values were for CA7. The more protein that was in solution meant the more opportunity that the PNPA had to act on the CA7 in the active site, and make it emit a yellow color as indicator of a functional protein. So, the more protein added the more yellow the solution should become at the 15 sec 5 minute readings. ********* Also, I will need to update this post or do another one once I get my data back from my LabNB. This is the reason why I have no XY graph or Bar Graph to show for assay today. Just know that I am satisfied that everything came out wonderful. I was really happy because assays are just as fun as watching paint dry. HA!

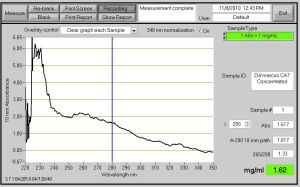
Fig. 1- Nanodrop ProtienA280 Reading of the concentrated CA7 protein. 1.62 mg/ml and the ABS value is 1.617. Note* The peak on the left of the graph may be salt.
Filed under: Enzyme Assays | Tagged: assaySO, concentration | 1 Comment »
You must be logged in to post a comment.