Transformation Efficiency


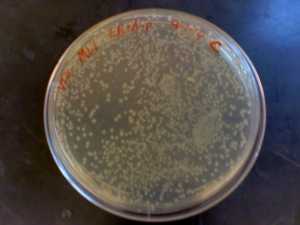
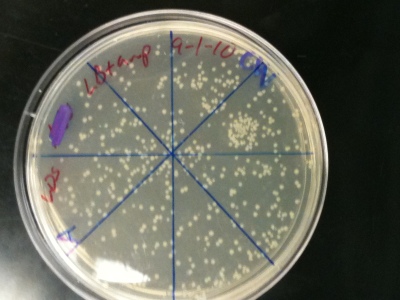
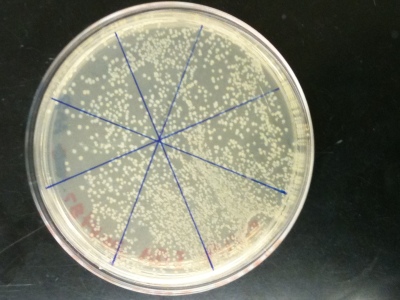
An ampicillan-resistant plasmid (pGFB) is introduced to E. coli bacteria to coax growth in its ampicillan environment.  These three pictures show E. coli strain DH5 Alpha growing on LB plates treated with SOC and ampicillan.  Varying amounts of plasmid (1 ng, 15 ng, and 25 ng) were added to the three plates to allow growth of the bacteria.  The amount of colonies grown under optimal conditions were then counted after 16 hours.  Plate C (25ng)  had the highest efficiency ratio of 72.32 colonies for each nanogram of pGFB added; followed by plate A (1ng) with a 50:1 ratio and finally plate B (15 ng) with a 16:1 efficiency ratio.  The plate containing the largest amount of plasmid- transformed cells was also the most efficient.  The second highest efficiency ratio belonged to the plate with the lowest amount of plasmid added (A), breaking the trend.  One explanation for these inconclusive results may be that the solutions of plasmid and bacteria prior to plating were not mixed properly.  A large amount of a cold substance may hinder the ability of equal dispersal.  The plasmid+bacteria of Plate A/C may have received slight but influential handling that led to more bacteria being transformed by the plasmid.  This experiment can be performed again with a goal being to affect all of the sensitive biological material in the same manner physically.

Candace’s Transformation Efficiency Report


Appx # of colonies: 696 colonies Efficiency: 696 colonies/ng

DISH A: Appx # of colonies: 696 colonies Efficiency: 696 colonies/ng

Appx. # of colonies: 3080 colonies Efficiency: 123 colonies/ng

DISH C: Appx. # of colonies: 3080 colonies Efficiency: 123 colonies/ng

The transformation of the component cells was successful. For the first time, I actually had a substantial amount of bacteria to grow. The plasmid used in this particular transformation was the pmCherry. I noticed a relationship between the amount of plasmid used and the number of colonies grown. The more plasmid used, the more colonies that were present on the LB-agar plates. The transformation efficiencies for the following plates appeared to decrease as the number of colonies grown increased. This relationship proves that a smaller concentration of colonies can provide for a more efficient transformation. Surprisingly, nothing substantial went wrong through the course of the experiment. Since the transformation of the component cells is completed, the next step to do is to run experiments to see if the cells can express the ideal gene or protein.

DISH B: Appx. # of colonies: 1883 colonies Efficiency: 377 colonies/ng

Transformation Efficiency


There were about 900 colonies growing in Plate A. The Transformation efficiency was 5.4 * 105transformants/ µg of plasmid. For Plate “B,” there were about 2500 colonies and the transformation efficiency was 5 *105transformants/ µg of plasmid. For Plate “C,” there were about 3000 colonies and the transformation efficiency was 1.2 * 105transformants/ µg of plasmid.

The experiment tested what concentration of plasmid (1ng, 5ng, or 25ng) would be more efficient. It was found that 1ng of plasmid was most efficient, followed by 5ng and 25ng. This is reasonable because the 1ng of plasmids would not have to compete for nutrients and space as much as in the case of 25ng of plasmid. For plate “A,” 1.68ng of plasmid was used instead of 1ng because pipetting less than 1 µl might not be accurate (1µl was used). The transformation efficiency for plates “A” and “B” were similar. The difference might have been greater if plate “A” contained 1ng instead of 1.68ng, or it might not change greatly.

The plasmid (pGFP) codes for the green fluorescent protein. In future experiments, pGFP could be used as a tag to identify which cells have taken up recombinant DNA. A low amount  of pGFP (such as 1ng) or increased amounts of nutrients and space could be used to increase transformation efficiency.

PCR of Scaled up CA7 – Note to Self: Need to do DPN1 Treatment!!


The experiment was my PCR with CA7 for pNIC-Bsa4 cloning (scaled up to 50 ul). The concentration of Mg2+ I used was 6 mM.

Lane 1:  Skip
Lane 2: 1 kb ladder
Lane 3-7:  20 ul CA7 (6mM Mg2+)
Lane 8:  No DNA control

Lanes 5-7 look really good, but lane 8 definitely has some DNA contamination, probably from when I was pipetting my samples into the gel (the samples like to float in the 1 x TAE buffer from lane to lane… I call it lane-hopping.)

Lanes 2 & 3 have fainter bands of DNA. This again was probably due to my pipetting. I was a little over-enthusiastic when pipetting lane 3.

The dark bands are my target (coding) region of CA7 that the PCR amplified. Above the dark bands you can see some junk DNA that PCR also amplified. This junk DNA probably includes non-coding regions of the CA7 gene that the restriction enzymes were still able to target.

Below the dark bands, you can see some faint bands near the bottom of the gel. These faint bands are probably leftover dNTP or primers because they are much smaller than the dark bands of DNA.

For this gel check, I was supposed to use the 100 bp ladder but used the 1 kb ladder instead. Thankfully, this doesn’t affect how my lanes turned out because the DNA ladder just shows how big the DNA is.

The next step would be to pool my samples into one and run it in three lanes (with the correct DNA ladder). Then I must DO DPN1 TREATMENT!!!! (because my template plasmid has Kanamycin resistance). After DPN1 treatment is PCR cleanup.

Transformation Efficiency


PLATE B: 1280 colonies. efficiency: 256 colonies/ng

PLATE C: 2744 colonies. efficiency: 109 colonies/ng

PLATE A: 271 colonies. efficiency: 271 colonies/ng

The transformation was successful. Each plate grew bacteria, and the number of colonies increased as the amount of DNA plasmid increased. The transformation efficiency decreased as the amount of DNA plasmid increased. From this phenomenon I gathered that the more bacteria there is, the higher likelihood for inefficiency there is. I used the pmCherry plasmid, which is supposed to fluoresce red under UV light, but I did not examine it under a UV light.

Resituation and Starting Midiprep


Happy first week back everyone! This week wasn't too eventful but
involved some vital planning for the next few weeks for me. Upon
returning to UT, I was surprised to hear that class was canceled
because Dr.B's son was on the way(congratulations!). But,
nonetheless, the research had to go on. On Wednesday,I added
glycerol to my pNIC-Bsa4 + CA7 protein for long term storage and
double checked its concentration - 1.36 mg/ml (29.147 uM, calculated
using Beer's Law). Additionally, I verified the presence of the
master plate from which I originally got my protein and ensured
correct labeling and storage. On Wednesday, I also deliberated
which direction to go in - repeat my enzyme assay, grow up more
protein, or Midiprep the protein I already had. Initially, I planned
to grow up more protein but, realizing the difficulty in stopping
over the Labor Day weekend, I talked to super mentor Adam and
decided to Midiprep instead. On Thursday,I began the Midiprep and
started the overnight culture of my pNIC-Bsa4 with CA7. On Friday,
I decanted and spun down my overnight culture and stored it in the
-20C fridge over the weekend. Also, I organized my notebook and
made sure everything was up to date. I plan to continue my Midiprep
next week, alongside performing the refreshers Dr. B has made and
beginning my virtual screening (potentially).

PCR- it’s finally over…I hope.


KRJ_9/2/10 pNIC cloning gel

KRJ_8_31_10 pNIC cloning gel-1

The gel from 8/31/10 was Run 1 of PCR cloning for the Fall. The top bands are exactly what I’m looking for but unfortunately the bottom band seems to be some sort of contaminant. If it weren’t so dark, it might have been primer dimers but that is probably not the case. The 2nd Run on 9/2/10 showed much better results. The dark bands that represented  Zhang was present and the lower bands were significantly lighter or not even there. The procedures used were exactly the same (annealing temp of 60 degrees for 20 cycles) so something must have just been contaminated when it was used on the first run.

VDS Bacterial Transformation


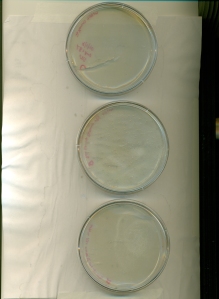
This picture represents the transformation of DNA plasmids into a bacterial cell. The DNA plasmids in each plate is at different concentrations and the result is that the concentration of bacterial colonies on the plate are different as well. Different concentrations of the DNA plasmids (PGFB)  mixes with SOC media  and the DH5 aplha super component  bacterial cells to be able to grow on the agar plate along with the LB Broth plus Amp. My bacterial colonies did not grow and I believe it was because the bacterial cells sat out on the desk at a unoptimal tempertature. This tempertaure can casue the bacterial cells not to operate properly and this tempertaure is were the bacetrial cells were placed in the plate. Another explaintation of the problem is that the SOC media for the expirement encountered some contamination. The next immediate step is to use that new DNA plasmid bacetria cells for lab research on different types of drugs or anti-biotics to cure diseases artifically without the use of animal subjects. Also,  the bacteria on the plate had characteritics which looked as if a sneeze or cough was subjected to the agar plate and grew up.

The Transformation Efficency for:

Plate A– 696 colonies/ng of plasmid

The number of colonies was 696.

Plate B– 1883 colonies/ng of plasmid

The number of colonies was 376.6.

Plate C– 3080 colonies/ng of plasmid

The number of colonies was 123.2.

Week of 09/03 Report


This week, I ran T107 on the FPLC and concentrated it down to 10 mg/mL.  Also ran T152 on the FPLC again and concentrated it down to 10 mg/mL.  Both of these proteins came off at around 65-70 mL and are probably dimers.

Figure 1:  T107 FPLC

Figure 2:  T152 FPLC

I also setup 96-well crystal trace traces with T107 / T152 using the Phoenix and started growing up small cultures of A107.