Posted on December 3, 2010 by damarcuseb
I used HTS13290 for my inhibition assay #2 at 5mM concentration. It worked. I was so happy. The importance of this assay is that the when inhibitor is in high concentration in the solution, there’s a saturation point. Another importance is that in this assay, the highest DMSO amount was 6% and from my DMSO assay the optimal concentration was under 4% DMSO. So as more Compound with DMSO was added to solution, the increasing DMSO could have altered the fuction of the protein and gave inconsistent results of inhibition at high compound concentration. The only thing I did differently was choose a new a inhibitor. Everything stayed the same for the previous inhibition assay.Also, my graphs from my first inhibition assay are posted on this one as well. For the HTS13290SC, 100 ul of nanopure, 80 ul of 100% DMSO and 20 ul of Compound HTS13290SC in stock. For Compound 5145897, 126.67 of Nanopure was used with 88.67 of 100% DMSO and 38 ul. of the stock compound. The working concentration for Compound 897 was 7.5 mM and for HTS13290 it was 5 mM.
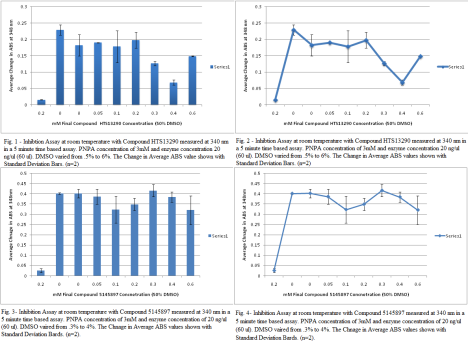 *Note- Inhibition is spelled wrong.
Filed under: Enzyme Assays | Tagged: assaySO | 1 Comment »
Posted on November 28, 2010 by damarcuseb
Well, for this last week, I will be working on my last trail for my inhibitor and then I will test another inhibitor. The first trail I did on my inhibitor did not seem to go well. When I added 6x the amount of inhibitor, it changed the ABS value at about the same rate. That made no sense, but I should have waited 5 minutes during incubation then measures the ABS, once that finished waited 5 minutes again and measured again. Instead I tired to make them go back to back and I could not remember if I had added inhibitor or PNPA. Next, time I will go one by one. I had to add 126.67 ul of Nanopure, 88.67 ul of 100% DMSO and 38 ul of my 5145897 inhibitor. My DMSO was 3 mM and protein was sill 60 ul of the 20 ng/ul enzyme concentration. The DMSO worked best under 4 % and all the DMSO was kept below 4%. I should have a graph up tomorrow when I perform my last inhibitor assay trail. Watch out for the inhibition assay. If you have a time based assy, do it one at a time. Also, make sure all the solutions are kept orderly so that you can keep track of what goes into the solution. I hope everyone had a good Thanksgiving. Now its time to finish up that report and finish up the last steps of our research.

CA7 in the Brain
Filed under: Enzyme Assays, Uncategorized | Tagged: assaySO | 2 Comments »
Posted on November 21, 2010 by damarcuseb
So. Friday. I lived in lab. I performed two varying substrate assays and two varying DMSO substrate assay. It was pretty straight forward. After I did varying substrate assay test, I took the values from the two different varying substrate assays and found their change. After the change was found from the two trails of assays I found the average of the change and found the Standard Deviation for the values. The enzyme amount used in the varying substrate was 60 ul of the 20 ng/ul Enzyme. When making solutions of my CA7 Protein in Tris Buffer, I would allow my protein to un-thaw, but as soon as I put it in the centrifuge tube, it would go directly back into the -4 degree refrigerator. The different concentrations of Substrate were 1.5,1.5,2,3,4,5,6,7 mM. The graph began to stabilize with the Standard Deviation off at about 3 mM and this was the concentration used in the DMSO assay. When looking at the graphs, you want to look at the place where thing begin to stabilize or decrease when adding the variant amount of substance whether its enzyme, substrate or DMSO. The DMSO assay only had varying amounts of DMSO (enzyme, PNPA is constant) as well and I was looking for that same stabilizing image to give me a proper DMSO value to use in inhibition assay. After adding 3.2% DMSO to the solution it begins to affect the function of the protein and substrate and the change in ABS values become small, and this is not what is desired. A functional protein is a must. Note: still done at the 15 sec 5 minute readings at the wavelength 348 nm. (Click the IMAGE to get a full view) Note: the Average ABS value is the Average for the Change of ABS Values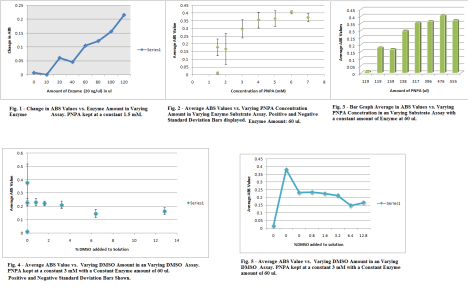 Also, when doing assays, I think a little trick is to add the Tris first, water, protein, and then the PNPA (DMSO last if doing the DMSO assays) When adding the PNPA before the protein, it could not allow the substrate to function in the active site as well. That may not be 100% true, but at least add the solution together a little before OD to let everything work together. TIP: When doing Standard Deviation or my acronym, (Finding the STD (Standard Deviation) LOL! Not Funny :] ) Anyways, On Excel 2007, go to the Layout Tab, go to error bars, more error bar options, then to custom on the bottom of page, and choose the calculated standard deviation values as the positive and negative values. Delete the horizontal error bars, by clicking on the horizontal bars on the graph and pressing delete.
Filed under: Enzyme Assays, Uncategorized | Tagged: assaySO, Standard Deviation | 1 Comment »
Posted on November 14, 2010 by damarcuseb
So, The week began with concentrating my protein to get out any other extra cellular material that would have otherwise been in solution during assays that could disrupt the function of the CA7 protein. The 15 ml cylinder filter was 20 kD, so my protein should have stayed in solution with the elution buffer during centrifuging to get the material out. I had to centrifuge the solution twice for 20 minutes to get the volume down to .5, but on the second centrifuge there was less than .5 in solution. To make up for this we had to add 500 ul of storage buffer to the tube and Nanodrop the solution to see what the protein concentration was. Before adding the glycerol, the protein concentration was 34.2 uM. After the protein was concentrated, I could now to assays. While preparing for the assay, I had to make PNPA solution, but when weighing out the solid I used the wrong balance. I added a minute amount of the PNPA , but the solution was yellow already which was not a good sign. When I made the PNPA for the second time, I used the ug balance to ensure I had the right amount of PNPA solid. Once the PNPA solid was made, I had to get the concentration of my protein down to 20 ng/ul and to do this I had to add 4 ul of my 31.184 uM Protein with glycerol, to 181.195 ul of Tris HCL Buffer at pH of 7.6. I needed a lot of protein about 400 ul to run the whole assay, I had to add about 12 ul of protein and 545.85 ul of Tris Buffer. Once all the prep was was complete, I proceeded to run my assay that had the different amount of protein in Sample A-H. As the assays were running and more protein was added to the solution the higher the absorption values were for CA7. The more protein that was in solution meant the more opportunity that the PNPA had to act on the CA7 in the active site, and make it emit a yellow color as indicator of a functional protein. So, the more protein added the more yellow the solution should become at the 15 sec 5 minute readings. ********* Also, I will need to update this post or do another one once I get my data back from my LabNB. This is the reason why I have no XY graph or Bar Graph to show for assay today. Just know that I am satisfied that everything came out wonderful. I was really happy because assays are just as fun as watching paint dry. HA!
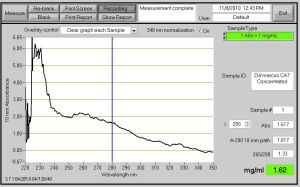
Fig. 1- Nanodrop ProtienA280 Reading of the concentrated CA7 protein. 1.62 mg/ml and the ABS value is 1.617. Note* The peak on the left of the graph may be salt.
Filed under: Enzyme Assays | Tagged: assaySO, concentration | 1 Comment »
Posted on November 8, 2010 by damarcuseb
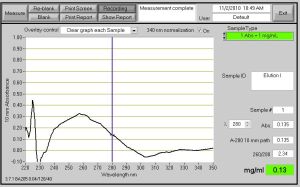
Fig. 1 - OD Valued Measured from Elution I after Protein Purification on 11/2/10. The OD Valued was .135 and the protein concentration is .13 mg/ml.
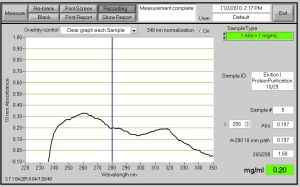
Fig. 2 - Elution I OD Value of .197 with .20 mg/ml. This is from Protein Purification on 10/29/10.

Fig. 3 - 2nd OD Valued Measured from Elution I after Protein Purification on 11/2/10. The OD Valued was .132 and the protein concentration is .13 mg/ml.
I was a bit confused by Fig. 2 because I actually obtained a solid OD value from this reading, but when I ran the Protein Gel, there was not a single band that showed up for Elution I done on 10/29/10. I took the sample on 10/29/10, but there should still be protein in the solution unless it was not mixed properly.
Filed under: protein expression, Uncategorized, Virtual Screening | Tagged: expression | Leave a comment »
Posted on November 7, 2010 by damarcuseb
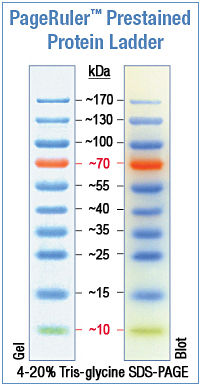
Fig. 1 - Protein Marker #SM0671 Lot: 00061923
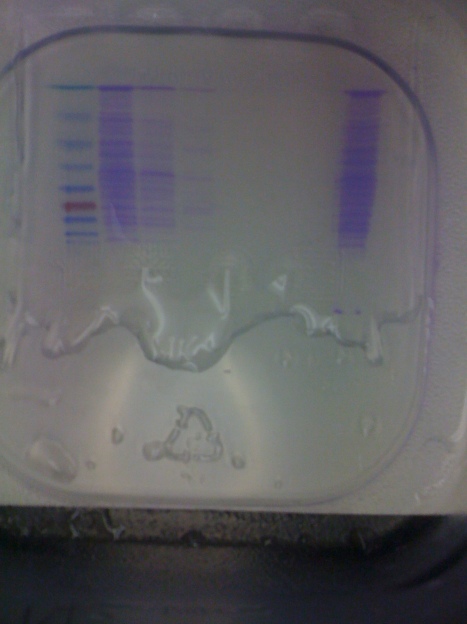
Fig. 2- The SDS Page Protein Gel in 1X TGS Buffer Stained with an Imperial Protein Stain. Lane 1 – Protein Marker Lane 2- Protein Purification Waste Lane 3- Protein Purification Wash Lane 4- Elution I (11/2/10) Lane 5- Elution II(11/2/10) Lane 6- Elution I from Protein Purification on 10/29/10 Lane 7- Elution II from Protein Purifcaiton on 10/29/10 Lane 8 Sample #2 (Soluble Fraction after Sonication) from Protein Purication on 11/2/10
This week I had to do another protein expression on Monday and Purification on Tues, It was really quick. This time I wanted to do things different and actually take time to babysit my growth to .6 but again I had to go to class. When I got back to add my IPTG my growth was 1.125 and 1.197 for flask A and B with the LB and my CA7 BL21 bacteria cells respectively. I really believe that adding the IPTG at .6 is the key component to obtaining an excellent yield from purification. The CA7 Protein I have must have the best function at that growth number and missing that number is critical for the bacteria to begin making more CA7. After Purification, I worked on the SDS Page Gel/Protein Characterization. I realized that in my elution from 10/29/10, I had a low protein yield. When I did protein expression and purification again, I obtained a higher yield, but it was not excellent. The next step is to protein concentrate to get all the other proteins that are in the elution I from the second expression and purification. Calculations from Protein Purification will be updated on the blog sometime this week as well. After that enzymes assays will occur and I am crossing my fingers hoping that my protein is functional or back to expression. There is nothing much to rehash as I have done this process before last week. The only thing that was sort of new was the page gel, but the class did that last year. Once I began the gel, everything began to flow back in my mind. Oh! I pHed the Elution Buffer for everyone. Yeah! Also, this week I ran 8 GOLD Libraries. The Images and data form the aggregate is on Google Docs, but the libraries that are on the aggregate are the CB306, ChemBridge, KINA, LOPAC and ZINCL Libraries. I had to use multiple blades and uses mulitple processes on that blade just to get all of these libraries run. I had 5 libraries from the CAII Protein, but after cloning and a new protein I had to change my GOLD protein and start all the way over. Hopefully I have enough functional protein and a functional enzymes that I can do some testing.
Filed under: GelImages, protein expression, Uncategorized, Virtual Screening | Tagged: characterization | Leave a comment »
Posted on October 30, 2010 by damarcuseb
When I do protein purification again do I add more Ni-NTA (1ml) to the supernatant after sonication or do I just pour the solution right in the column and allow it to sit for 45 minutes?
Filed under: protein expression, Uncategorized | Tagged: expression | 5 Comments »
Posted on October 30, 2010 by damarcuseb
Let’s Travel all the way back to 10/22/10. After I performed RE Digest for the second time, I had an epiphany. I have a new enzyme, CA7, so the RE Enzymes used from CAII probably will not work on my new protein. Let’s Check. Yes, it does not cut in the manner it would on CAII.
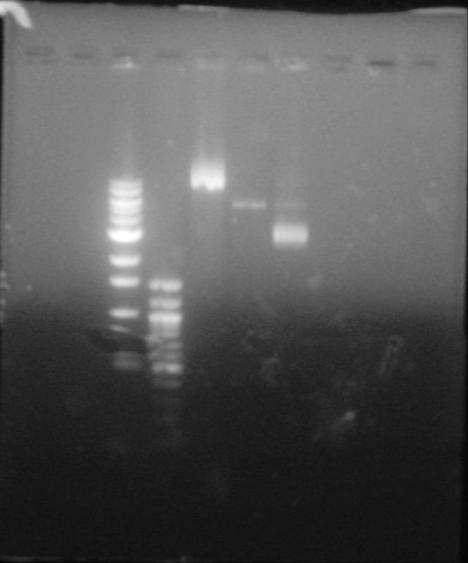
Lane I and II are skipped. Lane III and IV are the 1 kb and 100bp DNA Ladders respectively. Lane V is the uncut control plasmid of pNIC-Bsa4 with the stuffer fragment. Lane VI- is the DNA from Cloning of Colony 3 on the Master DH5alpha master plate. Lane VII- is the DNA from Cloning of Colony 7 on the Master DH5alpha master plate.
This was reassuring because I beginning to believe I was doing RE Digest improperly. Well after this, I sent off the sequence from Cloning of Colony 7 and Colony 4 to the ICMB Core, because Colony 7 resulted in four N’s for its whole sequence when the pLIC primers were used. While waiting on the results to come back, I put the DNA from Colony 3 and Colony7 in BL21 expression vectors and they came out great! I should have taken a picture of them, for everyone to see. Colony 7 looked weird again. The plate from Colony 7’s DNA from Cloning did not output distinct colonies as Colony 3 did. Now, I did add all 25 ul of the Transformation solution to the agar plate, so it could have been overcrowding in Colony 7. After this was complete, I began this week looking at the DNA sequences obtained from the core. Colony 4 came out again with CA7, but for Colony 7 from Cloning, the core gave me a sequence with 4 N’s. I am beginning to believe that Colony 7 from Cloning has the CA7 DNA in solution, but not in the pNIC-Bsa4 Vector. I choose Colony 3 to grow up my overnight culture, and then placed them in the 2 500 ml LB Broth for my OD Readings. At 600 nm, at 759 am the ABS value was .098 for B, and at 8:10 the ABS value was .110 for A. I was not able to babysit and check the OD values properly because I has class during the time of OD value check. After 2 hours, I came to check the OD values again and the 1st OD Value (ABS at 600 nm) at 11:30 was 1.606 for A and for B it was .856. (A and B come from the 2 500 ml flask that the solution of LB and bacteria were in.) After this, I added my IPTG and allowed it to incubate for 4 hours. After about 30 minutes, I realized I did not add my Kan to my new LB Solution, so I went on and added the Kan. Once that was finished, I put the LB in two tubes to allow them to centrifuge 20 min at 6000 g. The pellets weighed 48.17 grams. The pellets were resuspended and sonicated 2 days after that. Some of the solution spilled during sonication. After sonication the proteins were centrifuged again and then on to protein purification. The most tricky part of protein purification was the balancing the ph correctly because the HCL and NaOH are so concentration and a drop could totally change the pH of the protein. Question: Were my protein’s denatured? My pH went down to around 5.2 went I added the HCL, could that have been the source of the low protein yield that was to come after purification. Once the pH was at the proper value, I added the 1ml of the Ni-NTA slush to the solution and allowed it to incubate for 45 minutes. Another issues that could have arose was that I did not incubate as often as I should have to allow the protein to bind to the Nickel. Next Time, I will put the ice bucket directly in front of me and invert it every 5-10 minutes, so the Nickel will stick to the protein. I performed the rest of the task of protein purification and when the elution were taken I used the buffer that had 150 mM of NaCl instead of the 300 mM NaCl. 150 mM is close the the physiological concentration, but 300 mM creates the best protein binding environment to the Nickel. Once purification was complete, I Nano-dropped the solution to find out my protein yield. The yield for elution one was .110 at the highest. I forgot to keep the picture of the graph for that because I Nano-dropped again an kept keeping positive and negative protein concentrations. So I am back to growing up my bacteria for expression. I went into lab today to make LB and autoclave it, but the autoclave was having issues. The solutions of LB are made, but they have not been autoclaved. When I do expression the next time I have to be more careful of what I am doing and make sure I have time to babysit the LB to grow to the proper value of .6.
Filed under: GelImages, protein expression, Uncategorized | Tagged: expression | Leave a comment »
Posted on October 22, 2010 by damarcuseb

Fig. 1- 1% Agrose Gel with EtBr performed in TAE. Lane 1- 1 Kb Ladder Lane 2- 100 bp Ladder Lane 3- Cut DNA grown from Colony 1 during Cloning Lane 4- Cut DNA grown from Colony 2 during Cloning Lane 5 - Cut DNA grown from Colony 3 during Cloning Lane 6- Cut DNA grown from Colony 4 during Cloning Lane 7- Cut DNA grown from Colony 5 during Cloning Lane 8 - Cut DNA grown from Colony 6 during Cloning Lane 9- Cut DNA grown from Colony 7 during Cloning Lane 10- Cut DNA grown from Colony 8 during Cloning Lane 11- Uncut pNIC Bsa4 vector with stuffer fragment insert ******* Note All DNA was Double Digested with SspI and BsrgI Restrction Enzyme
Well this was interesting. So I tried to follow the protocol from the RE Digest that VDS performed at the begining on the year with 1.5 ug of DNA to insert into the tube so that the restriction enzymes could cut it. From that protocol 1.5 ug were added to the centrifuge tubes, but my concentration of DNA was in the 20’s (ng/ul) for all the tubes except Colony 7. This 1.5 ug was all of my DNA concentration for my samples from my Transformation I and from there I still followed the old RE Digest protocol. I added .5 ul of both Restriction Enzymes, SspI and BsrG I, 2.5 ul of NE Buffer and continued on with RE Enzyme Digest. I did the 2 hours at 37 degress Celsius then ran the gel. Once, I put the gel under UV light and looked at it, I saw one band and then it i hit me. I over-saturated my solution with DNA and did not add enough RE Enzyme to compensate for that difference. The concentration of the whole RE Solution should have been 25 ul, but mine was 60 ul due to the excess amount of DNA. Then I continued to think to myself, what else could have went wrong. Ahh! I forgot to heat block at 80 degrees Celsius for 20 minute to stop the enzymes function. Still, I sent Col 7 and Col 3 to DNA Sequencing. I got my results back from the lab, Col 7 was not a good sequence. It had a lot of N’s in the Coding Regions, but then there was hope. I apparently sent to much DNA to the sequencing lab (500 ng?), so they were going to re-run my DNA. Yes! No! I got back my results this morning and guess what it was. 5 N’s for the forward and reverse sequence. Success! Not! Well, my Colony 3 results were a little more uplifting than the Col 7 results. So I got my sequence with all the Coding Regions with DNA bases in the Coding regions and the N’s at the beginning and ends. I am excited. Then, I do a nucleotide blast and insert my sequence. As I cross my fingers hoping 7its my gene, and the results flash. It’s Carbonic Anhydrase 7. What! How did I get CA7. All the tubes I have used were labeled 40190. That’s CAII. Well, from talking to Dr. B about the matter, I would like to introduce my new enzyme CA7. Bye. Bye CAII, i do not know where you went, but CA7 is what I will be working with now. I am doing another RE Digest properly this time, and am abating my results from that. I hope that goes well, but still I forgot to cur the pNIC Bsa4 vector again. I hope the virtual gel and uncut pNIC Bsa4 control sufficient enough to give me enough for analysis.
Filed under: cloning | Tagged: RE digest | Leave a comment »
Posted on October 19, 2010 by damarcuseb
Posted on October 15, 2010 by damarcuseb

Fig. 1- DNA Concentration of 33.3 ng/ul and the DNA grown up for this Nanodrop was from the bacteria growth in the 15ml tubes which cut the Oxygen supply.
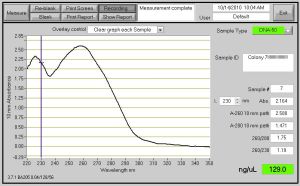
Fig. 2- DNA Concentration of 129 ng/ul and the DNA grown up for this Nanodrop was from the bacteria growth in the 14ml round bottom tubes which does not cut the Oxygen supply. Also, when spinning down the cells for this DNA, I did not take out the toothpicks.
I have 16 pictures from Nanodrop after I transformed, grew up the bacteria and Miniprepped them. The top 2 are posted, because I figured you would not want to see 16 pictures. After the Masterplate grew up, I took a tooth pick, and sequentially added each numbered bacteria colony to a numbered tube. Each Numbered tube had 5ml of LB with 50 ug/ml Kanaymycin (5 ul of Kanamycin per tube or 250 ng for all the 8 tubes.) I did not spilt up my bacteria growth and grew them up for 8 hours straight. After my bacteria grew, I took out the toothpicks and spun them down at 5000 rpm for 5 min. Next, Mini-Prep was performed on the DNA and then came the fun part. After mini-prep (I eluted in 50 ul), I proceeded to the dreadful Nanodrop. The highest DNA Concentration for the first time was 33.5 ng/ul. So, guess what, I had to perform these steps all over again. Although, I had to repeat some steps were changed along the way. When I was growing up my bacteria, I used a round bottom tube this time instead of a 15 ml colonial tube. The round bottom tubes are better because they have a loose top which enable the bacteria to consume more Oxygen for growth and the round bottom tubes are much CHEAPER than the other tubes. When spinning down the round bottom tubes, I had to parafilm the tops of them, so the liquid was secure in the tube. The first time I spun down in the 15ml tubes, I took out the toothpicks, but the second time I did not. Nothing was effected. Miniprep was done next, and the first time I eluted in 50 ul ph 8.0 water, but the second time I eluted in 30 ul of Tris-HCl. On average, my concentration of DNA from the first Miniprep was 26 ng/ul and for the second Mini-Prep it was about 52 ng/ul. In conclusion, the second time I minipreped with less elute I got a stronger concentration of DNA for use of RE Digest and DNA Sequencing. Also, for RE Digest the enzymes I will be using are SspI and BsrgI.
Filed under: cloning | Tagged: clones, colonies | Leave a comment »
Posted on October 15, 2010 by damarcuseb
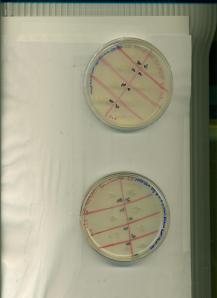
Fig. 1- Image of the Master Plate after transformation was successfull and 8 colonies were hand selected to put placed in a numbered grid (1-8). When DNA is grown up, it will be easier to go back and refer to the colony that has the insert or not, because the numbered tubes help organize colony growth and cloning. The agar plate on the bottom contains the protocol mix of Cohesive Generation solution of the Accepting Vector (2 ul) and of the CAII Insert (4ul). The agar plate on the top contains my own remixed amount of accepting vector(2ul) and CAII Insert(8ul). Note: Each Agar Plate contains 5% Sucrose and Kanamycin Resistance. The Sucrose is for negative selection of colonies without the insert.
Yes! Bacteria grew up on my original plate and I had enough colonies to make a master plate. When I performed all the steps to get to the image that is shown, I had to prepare my pNIC-Bsa4 accepting vector, so that it is empty and has the chance to take up my plasmid. After that, I had to perform cohesive end generation on my CAII insert and my pNIC-Bsa4 accepting vector. I did not know what co-hesive en generation was so I looked it up. Dictionary.com gave this definition. Cohesive End – Single-strand extension on each end of a duplex DNA molecule that is usually produced by restriction endonuclease digestion and which facilitates ligation of two similarly cut DNA molecules. Called also sticky ends. Also, the t4 DNA Polymerase Buffer is the NEBuffer 2. This was found in the catalog, in the VDS Solutions cabinet. When annealing and transformation was ready to be accomplished I did two different mixes of Accepting Vector and CAII Insert, one from the protocol and another from whatever I wanted. The DH5aplha cells I used were the Invitrogen One Shot Max Efficency Tr1 cells. When all my solutions were prepared and I could spread my bacteria with the plasmid on my plate, I used the metal loop, which I heat steralized and let sit for 30 sec so it does not burn my bacteria. After this was incubated overnight, it grew up about 15 colonies, then was stored in the fridge. On Monday, October 11th, I picked 8 colonies to be put on a master plate and grew them overnight, so I could grow them up in tubes next.
Filed under: cloning | Tagged: clones, colonies | Leave a comment »
Posted on October 14, 2010 by damarcuseb
Sc1
Pbu2
EcoRI
BasaB1
Sac2
BSA1
SsspI
AFL2
PML1
2RA1
Eag1
Bsrg1
Da’Marcus
Filed under: Uncategorized | Leave a comment »
Posted on October 9, 2010 by damarcuseb
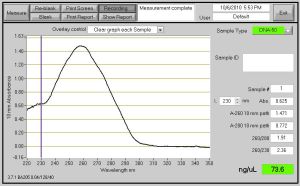
Fig. 1 - DNA Concentration of 73.6 ng/ul after a second PCR Clean Up after DpnI was completed.
The next step after PCR Cleanup on the CAII DNA that was amplified, DpnI treatment was performed because the template vector from PCR had to be destroyed so it does not carry over to transformation. The was necessary because the accepting vector and the template plasmid from PCR have the same bacterial resistance gene. If both of them have the same resistance gene then bacteria that did not transform correctly would not be killed off due to the presence of double resistance. DpnI cuts the remaining template molecules after PCR reaction with selectivity based for methylated DNA from the bacteria. I used 2 ul of DpnI, 15 ul of water, 5ul of NEBuffer 4 and allow it to incubate for 37 degrees Celsius 30 min and heat inactivate at 85 degrees Celsius for 20 min. Once Again, DNA concentration was lessen due to a second PCR Clean-up.
Filed under: Uncategorized | Leave a comment »
Posted on October 9, 2010 by damarcuseb
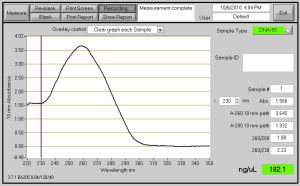
Fig. 1- 40190 DNA Nanodrop Concentration of 182.1 ng/ul after PCR Cleanup was performed.
After DNA Amplification, PCR clean up was performed on the CAII DNA. The centrifuge was prepared by a Column Prep Solution and spun down. After that a 5 to 1 ration of Binding Solution to DNA, and spun down another time. PCR Clean up is performed in lab so that the DNA will be pure of all extra cellular components. The only down side to performing PCR clean up is that there is a decrease of DNA concentration in the eltuion solution, but pure DNA is needed to clone in the DH5 alpha bacteria cells. When expression times comes aorund, no other protein should be expressed in the E. Coli.
Filed under: Uncategorized | Leave a comment »
 *Note- Inhibition is spelled wrong.


You must be logged in to post a comment.